System Characterization
Beam Characterization and PSF Analysis
To characterize our constructed system, we first image the generated light-sheet using the sample chamber transmission configuration shown below, where the illumination objective is placed directly in front of the detection objective. The image of our light sheet is shown in (a) below, where the cross-sectional profile of the light-sheet is shown in (b) and reveals a z-FWHM of ~0.415 um.
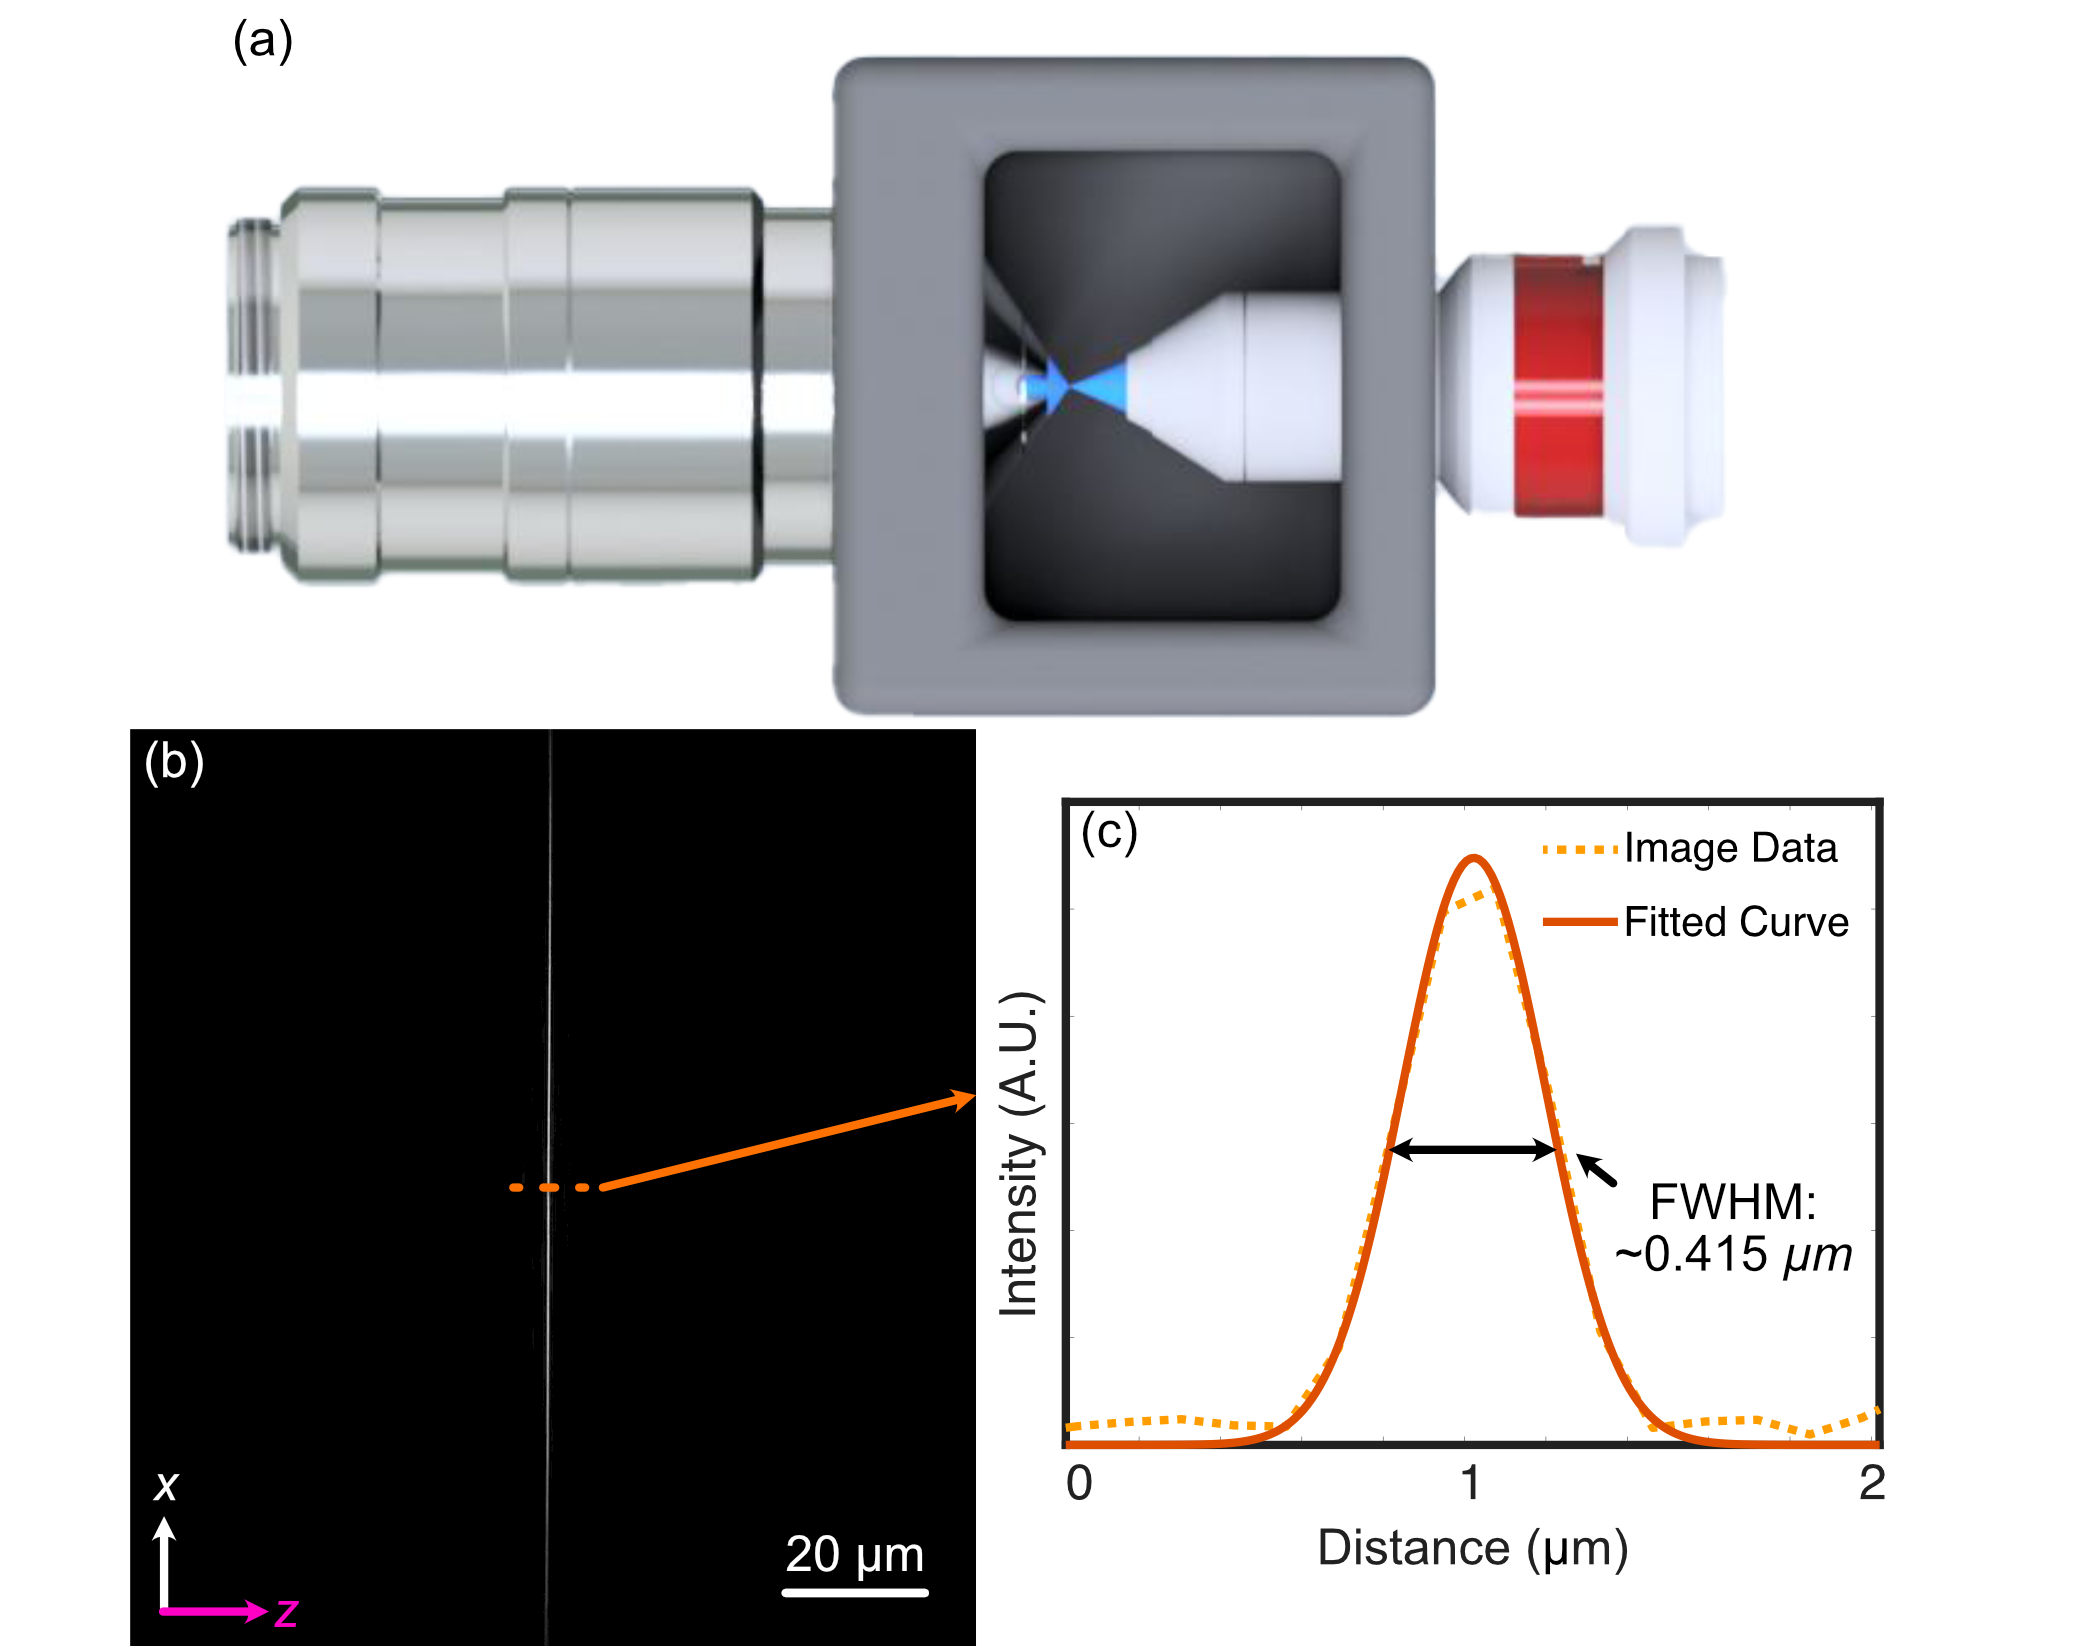
Figure 1: Analysis of the experimental lightsheet characteristics
To characterize the resolution of our system, we utilize 100 nm YG Fluorescent Beads (ID: 17150-10) from Polysciences Inc. The beads are first affixed onto a 5 mm coverslip using the following protocol:
Note
Affixation protocol for 100 nm beads
Assemble petri dish, coverslip, and 5mM concentration (3-Aminopropyl)triethoxysilane (APTS)
Put 5 mm coverslip in petri dish
Apply ~100 microliters of (3-Aminopropyl)triethoxysilane (APTS) on top of coverslip
Allow APTS to incubate for ~10-30 minutes
Wash coverslip lightly with DI water 3 times
Put beads of desired dilution (typically 10^-3 or 10^-4 for a normal distribution, 10^-6 for a sparse distribution) onto coverslip and allow to incubate between 2-20 minutes. Longer incubation time allows for more beads to adhere to the coverslip
Wash lightly afterwards with DI water
After affixation, the beads are then imaged, the results of which are shown below. The PSF of an isolated bead is shown below in (a-c), where each image is a different orthogonal perspective of the bead’s intensity distribution, and provide us insight into the resolution of our system in each orthogonal direction. We then provide Gaussian-fitted distributions of the FWHM of the population of fluorescent beads across a given z-stack in (d), both before and after applying deconvolution procedures. Prior to deconvolution, the average FWHM values across the bead population were 328 in x, 330 nm in y, and 464 nm in z. After deconvolution with PetaKit5D, these values improved to 235.5 nm in x, 233.5 nm in your, and 350.4 in z.
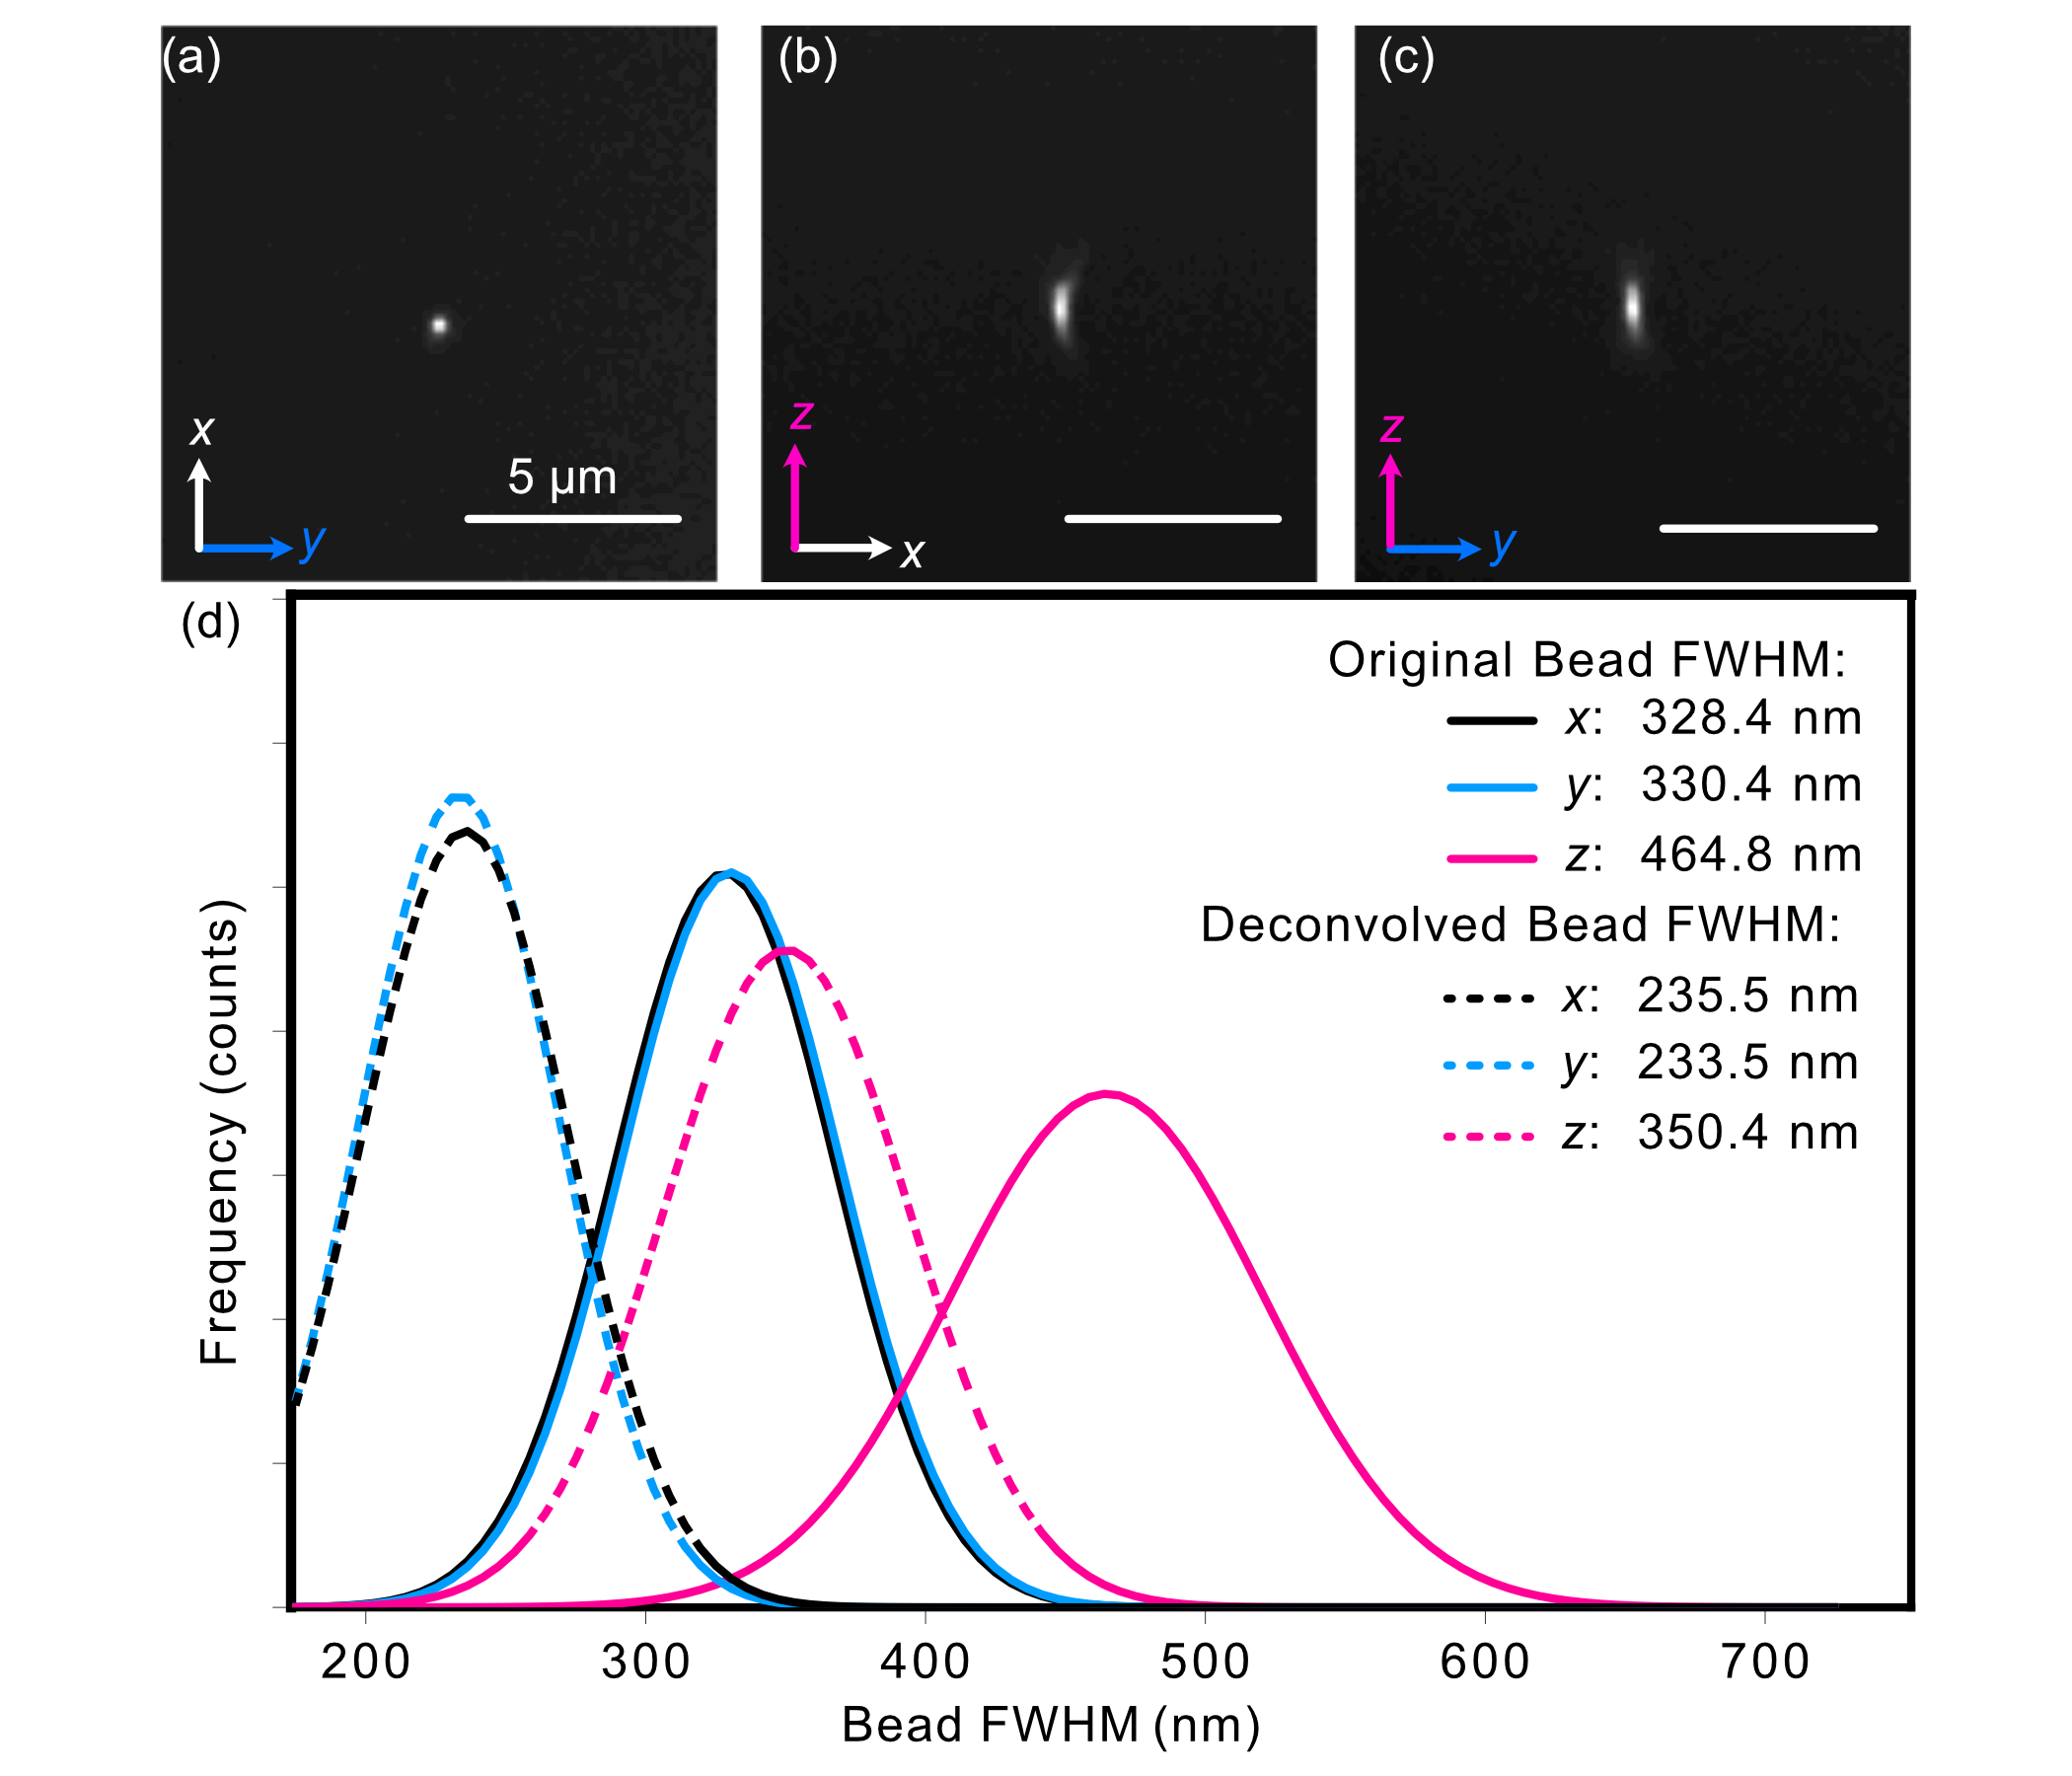
Figure 2: Analysis of the experimental PSF characteristics
Sample Biological Images
As a demonstration of COMPASS’ biological imaging capabilities, we prepared and imaged mouse embryonic fibroblast (MEF) cells, where multiple subcellular structures were stained for 4 different channels corresponding to the excitation wavelengths of our laser source (405 nm, 488 nm, 561 nm, 638 nm). The staining protocol described in [cite Compass paper] was optimized for visualization of the nucleus (DAPI, 405 nm, cyan channel), microtubules (488 nm, gray channel), actin filaments (561 nm, gold channel), and the Golgi apparatus of the MEF cells (638 nm, magenta channel).
A deconvolved maximum intensity projection of a distribution of MEF cells is shown below in (a) and (f), with each individual channel displayed in (b-e) and (g-j). These results display fine nucleolar features within the nucleus, well-defined perinuclear Golgi structures, well-resolved stress fibers in the actin channel, and individually distinct microtubules, demonstrating COMPASS’ ability to capture high-resolution images of cytoskeletal structures.
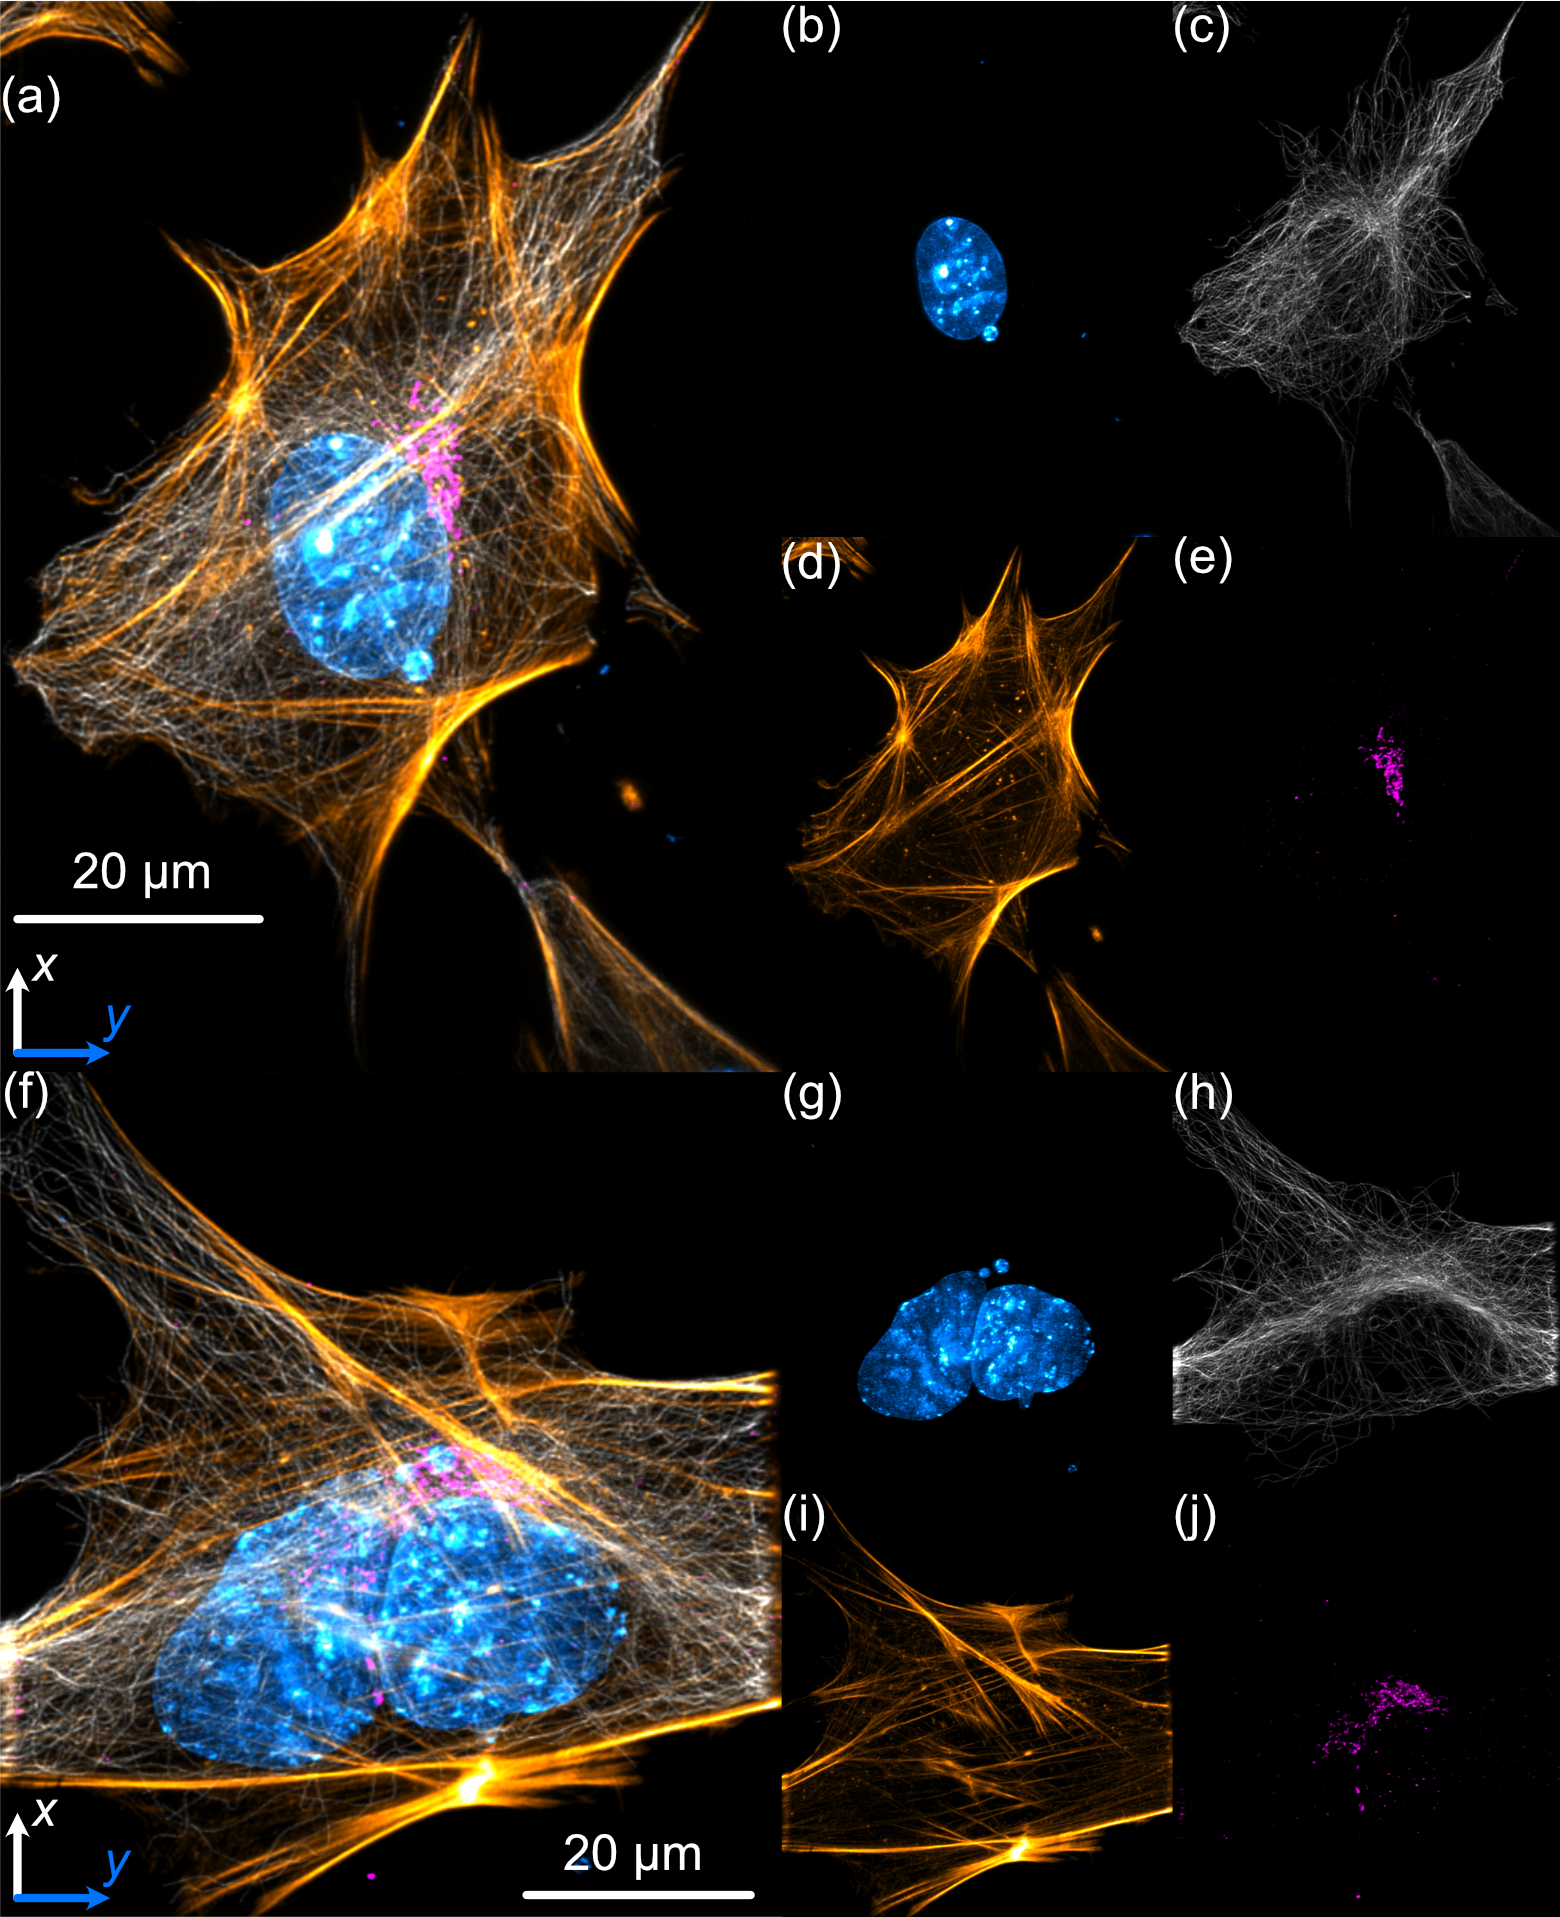
Figure 3: Analysis of MEF Cells