Rendering biological data with napari#
Welcome to the online handouts for napari Workshop Datasets: Deciphering the Living Cell through Microscopy and Computation, November 16–17, 2026.
This three-hour workshop is written for biologists with little or no programming experience. Start with your operating system setup page before class. During class, the main notebook takes you from an image array to a deliberately styled view with supplied detections and tracks, then to a saved PNG or short movie.
Download the course files · Download offline HTML handouts
JupyterLab opens in a browser and runs the explanatory notebook. Napari opens in a separate desktop window on the same computer. Opening this website alone cannot launch that local Qt viewer.
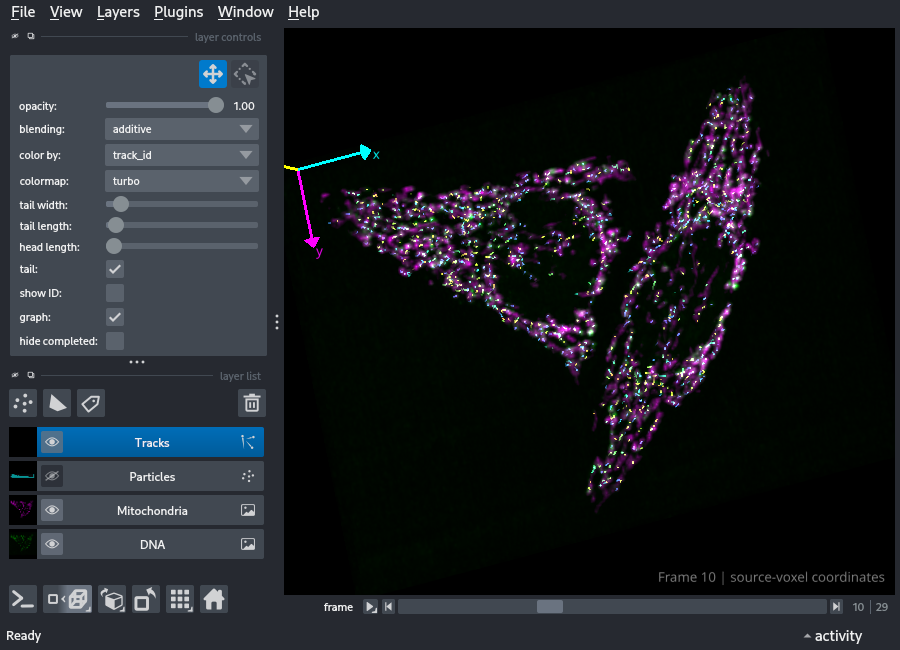
The reference above is a real render of the prepared course data at frame index 10. A matching 2D projection supports the fallback route. These images were produced during Linux validation and do not claim a successful Windows or macOS platform test.
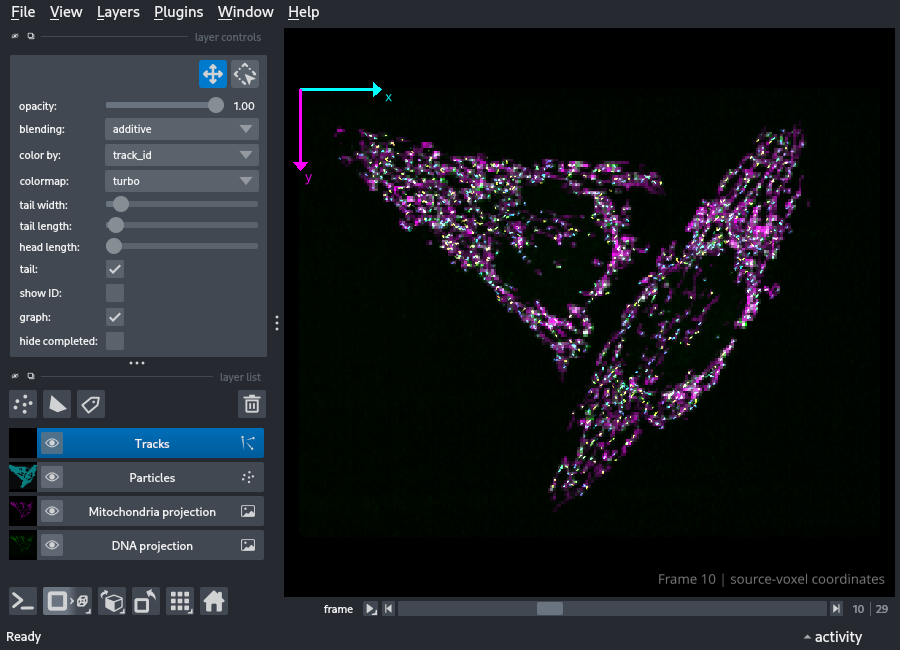
Download the reference time-series MP4 (30 acquisition frames, displayed at 10 playback frames per second; source data CC BY 4.0).
Scientific boundary
The points and tracks are precomputed. The workshop displays and interprets them; it does not run new detection or tracking. Coordinates remain source voxels and time remains a frame index because physical calibration and acquisition timing are not yet confirmed.
Begin
- Rendering biological data with napari
- Windows setup
- macOS setup
- Download the data
- Troubleshooting
uvis not foundpyproject.tomloruv.lockis missing- The lock file is out of date
- The kernel is absent or wrong
- The workshop folder was moved or renamed
- A notebook cell is busy or cells ran out of order
- Napari does not appear
- Qt, OpenGL, graphics, or a blank 3D canvas fails
- The data folder is missing or nested twice
- A download is slow or interrupted
- A point or track does not align with the image
- Saving is not exporting
- Movie export fails
- Memory use is high
- An output folder already exists
Workshop notebooks
- Before the workshop: check your setup
- Rendering biological data with napari
- 1. Run your first cells
- 2. Open a single image
- 3. Choose a useful display
- 4. Explore depth and time
- 5. Compare a projection with a volume
- 6. Add existing particle detections
- 7. Add existing tracks
- 8. Return to 3D with the same coordinates
- 9. Save a screenshot
- 10. Make a short movie
- 11. Your independent challenge
- Optional: camera movement and acquired time
- Optional: downsampling and loading data only when needed
Notebook source files:
Student handouts
Instructor materials
The teaching dataset and original source dataset have separate Zenodo records, both under CC BY 4.0. The main teaching package is a factor-4 spatial derivative that keeps all 30 frames and loses fine detail. Use Download the data for the verified course route.