Display Notebooks
The display notebooks provide visual feedback for image and waveform data during acquisition.
Camera View
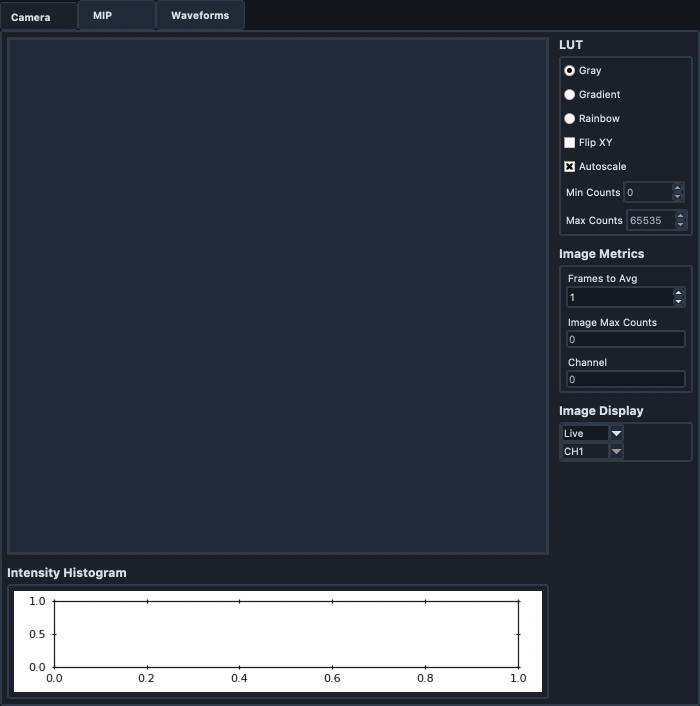
The Camera View notebook shows the current image and display controls.
Left-clicking the image toggles crosshairs.
The right panel includes Display Mode, LUT, image metrics, and image display controls.
Display updates are deferred when the tab is hidden, then refreshed with the newest frame when the view is visible again.
HistogramFrame

This frame displays the current image intensity histogram.
IntensityFrame
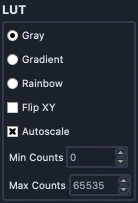
This frame now uses one compact LUT editor for both single-channel and multichannel workflows in both Camera and MIP tabs.
Channel selects which channel settings are being edited.
In Single mode, channel selection is fixed to All and disabled.
In Overlay mode (with multiple active channels), channel selection is enabled so each channel can be configured independently.
LUT uses ImageJ-style colors (Green, Red, Magenta, Cyan, Yellow, Blue, Orange, Gray).
Visible toggles channel contribution on/off.
Alpha controls per-channel opacity from 0 to 100%.
Gamma controls per-channel gamma from 0.0 to 2.0 (default 1.0).
Autoscale applies per-channel automatic min/max scaling.
Min Counts and Max Counts are used when autoscale is disabled.
MetricsFrame
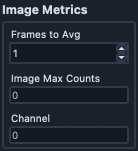
Frames to Avg is currently a placeholder for averaging behavior.
Image Max Counts reports maximum image intensity.
Channel indicates which selected acquisition channel is being displayed.
RenderFrame
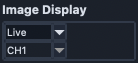
This frame switches between live and slice display modes. When channel-aware LUT controls are active, the channel selection in this frame is disabled.
MipRenderFrame
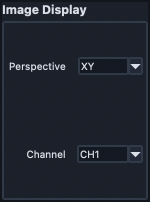
This frame controls MIP perspective and channel selection.
Perspective provides Multi, XY, ZY, and ZX views.
In Multi perspective, the XY MIP is shown with YZ on the right and XZ on the bottom.
YZ and ZX views are rescaled from acquisition metadata so axial and lateral spacing display isotropically.
Waveform Settings
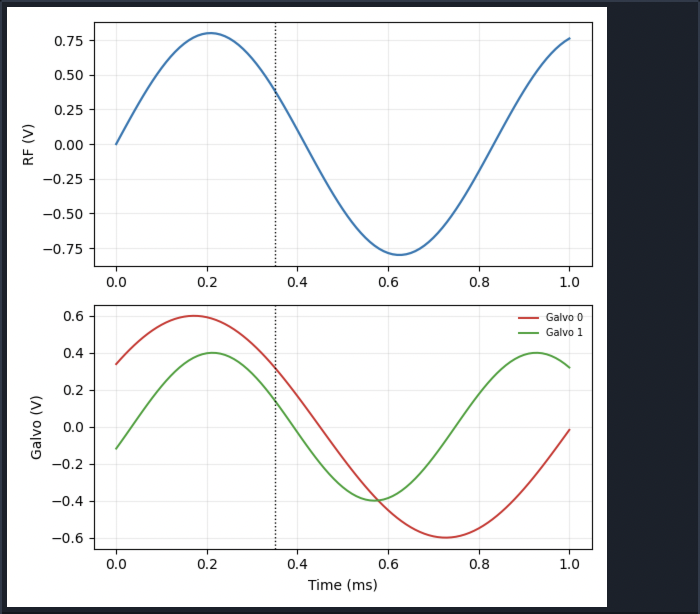
WaveformPlotFrame
This frame displays generated remote-focus and galvo waveforms. The dashed vertical line indicates camera timing relative to waveform output.
WaveformSettingsFrame

Sample Rate controls DAQ sample frequency.
Waveform Template selects the active waveform template.